Unless you’re an accounting major, you probably don’t have much experience with Excel. It can be an extremely powerful tool that can help you both personally and professionally. Let’s take a moment to discover some basic features that many of us may not know about.
Cal Poly Pomona (CPP) students are lucky enough to have access to Office 365 for free! Log in to your CPP email and click Office 365 or navigate here. You can download all three programs at no cost, which includes the latest software updates so you’ll always have access to the newest features.
This series will run you through the basics of how to create successful Microsoft Office documents that may help you land your dream job.
The second of our Microsoft Office for Dummies series features Excel.
1. Sheets
If you look in the bottom of an Excel document, you’ll notice little tabs that say Sheet 1, 2, 3, etc. These are like browser tabs. You can organize different information that pertains to the same topic. Say you’re using Excel to plan a family vacation. Each tab can represent an aspect of the trip: food expenses, itinerary, receipts. By using sheets, you save yourself from having multiple Excel documents that you can easily lose track of.

Image courtesy of: cloud.addictivetips.com
2. Formulas
If you’ve ever used Excel to keep track of expenses and you’re doing the math in your head, you’re doing it wrong. Formulas are a fundamental resource to use in Excel. You can do everything from simple addition to statistical calculations. Below is an example of how easy formulas are to use. The user clicks in cell A3 and inputs the equation in the formula field. The best part about formulas is that the answer will automatically update if you change the data in the cells. So if you find out dinner actually cost $300 not $30, you’ll know who to shake down in your family for more money at the end of the trip.
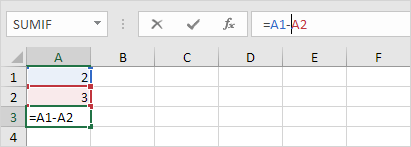
Image courtesy of: www.excel-easy.com
3. Charts
If you’ve ever wanted to achieve a professional looking chart to convince your parents the statistical benefits of you acquiring the new iPhone, you should turn to Excel. With a little organization, you can create a chart without much effort. In the example below the user is comparing the sightings of various animals in various months.
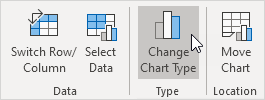
Image courtesy of: www.excel-easy.com
Once the data has been entered, you select the type of chart you want to create. Here they’ve turned the data into a bar graph. Much like formulas, if you change any data in your document the charts will update with little effort from you.
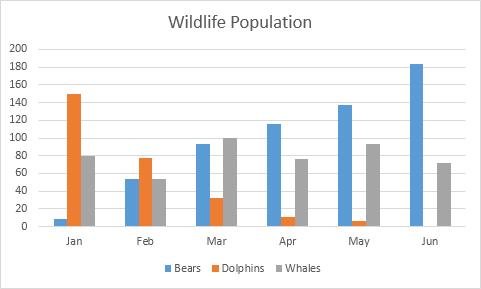
Image courtesy of: www.excel-easy.com
4. Number Conditioning
Stop typing that dollar sign! Excel can do that for you! It can also do things like convert decimals to percentages, round your decimals and add commas. At the top of your screen check out the “Number” area. The drop down menu will give you a wide array of number formatting, while the most used functions have dedicated symbols. The symbols with the zeros will add decimal places or decrease decimal places respectively.
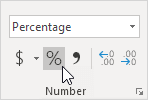
Image courtesy of: www.excel-easy.com
5. Diagonal Text
Probably one of the most simple things to do on Excel that most people will have to Google every time. Familiarize yourself with the Alignment tab (the little AB symbol with the arrow underneath), which is going to make you look like an Excel wiz. You can rotate text any which way your heart desires. This will make cells with lengthy text appear organized, and a level of sophistication to your document.

Image courtesy of: www.excel-easy.com
What tips from this list will you use in your next spreadsheet? Let us know using the hashtag #CampusCropChat on Facebook, Twitter and Instagram, and don’t forget to follow us on Snapchat @asicpp!